After learning the definitions and concepts of direct proportion and inverse proportion in mathematics, the next step to study is linear functions. Similar to the graph of direct proportional, it is linear functions that if the value of $x$ increases, the value of $y$ increases in the same ratio.
In linear functions, there are two concepts: slope and intercept. Depending on the slope and intercept numbers, the shape of the graph will change. Linear functions also require us to draw graphs and create linear equations from them.
There are many problems that ask for the intersection point, and in such cases, the intersection point can be found by using simultaneous equations.
The concept of linear functions is almost the same as that of direct proportions. Therefore, we often use linear function calculations in our daily lives. So we will explain how to solve problems with linear functions.
Table of Contents
- 1 Linear functions Are Special Proportions
- 2 How to Draw a Linear Function Graph
- 3 Find the Equation for a Linear Function from Intercept and Coordinates
- 4 How to Find Intersection Coordinates Using Linear Functions
- 5 Exercises: Linear Function Graphs and Word Problems
- 6 Create and Solve Equations for Linear Functions
Linear functions Are Special Proportions
There are many things that are related to proportions. For this reason, we use proportions frequently in our daily lives. Another concept that is also essential in our daily lives is linear functions. Proportions and linear functions are similar, and all of us use linear functions in our daily lives.
For example, we use linear functions when we think about our daily living expenses. It is the calculation of a linear function to figure out how much you can spend each day based on your current savings.
The formula for proportionality is $y=ax$. For example, if you get an allowance of \$20 per month and you don’t spend any money at all, your savings after $x$ months will be expressed by the following equation.
- $y=20x$
If you save money from zero, the equation will be a linear equation like this. On the other hand, if you already have some money saved, you have to take into account the amount of money you have saved.
For example, if you already have \$50 in savings, the total amount of savings after $x$ months will be following.
- $y=20x+50$
In real life, it is common to start from a specific point, rather than starting from zero. In linear functions, we create an equation that takes this into account.
Let’s think of linear functions as a special case of proportionality. A linear function is a proportion that does not start from zero but from a specific point.
Linear Functions Have a Slope and Intercept, Resulting in the Formula $y=ax+b$
The formula for direct proportion is $y=ax$. On the other hand, the formula for a linear function is $y=ax+b$. To start from a specific point, we add $+b$ to the proportional formula.
$b$ is the value at $x=0$. In the previous example, you already had \$50 in savings. Therefore, $b=50$.
In linear functions, $a$ in $y=ax+b$ is called the slope. Also, $b$ is called the intercept. Remember these words because linear function problems frequently ask for the value of the slope and the intercept.
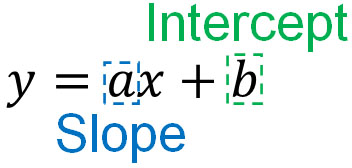
For example, suppose we have the equation $y=-2x-5$. In this case, the slope is -2. Also, the intercept is -5. The equation is almost the same as direct proportion, so the concept is not difficult. Just make sure you remember the words.
-Some Problems Have A Domain
Mathematics is something we learn to apply to our daily lives. Therefore, some math problems have a variable domain.
For example, let’s say you want to fill a family pool with water. However, the amount of water that can be in the pool is fixed. You cannot pour an infinite amount of water into the pool.

Therefore, the range of $x$ may be determined. This is called a domain. Also, because of the $x$ domain, the range of $y$ can be determined.
How to Draw a Linear Function Graph
When learning about linear functions, you must understand how to draw graphs as well. How do you draw a linear function graph?
A linear function has a property. That is, the graph $y=ax+b$ always passes through the coordinate $(0,b)$. For example, let’s substitute $x=0$. The result is as follows.
$y=a×0+b$
$y=b$
Thus, when $x=0$, $y=b$. Since it passes through the coordinate $(0,b)$, the coordinate that intersects the $y$-axis is always $b$.
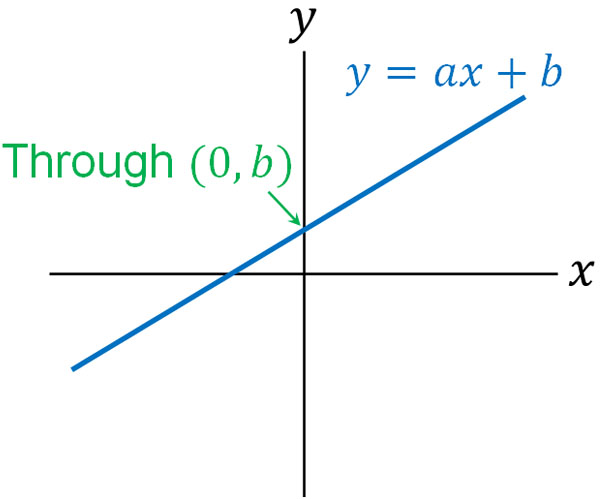
So, when drawing a graph of a linear function, focus on the intercept first. For example, the graph $y=-2x+3$ will be a graph passing through the coordinate $(0,3)$.
Next, find the $y$ coordinate by putting your favorite number in $x$. For example, in the graph $y=-2x+3$, if $x=1$, then $y=1$. In other words, it passes through the coordinate $(1,1)$. Then connect the two points $(0,3)$ and $(1,1)$ with a straight line.
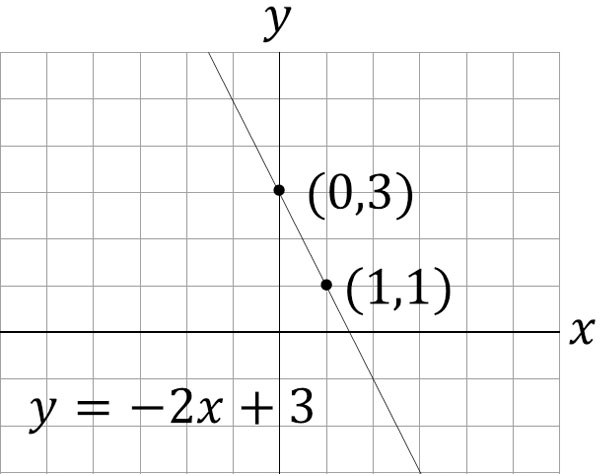
The graph $y=-2x+3$ is a line passing through two points $(0,3)$ and $(1,1)$. You can substitute any number into $x$: 1, 2, 3, etc., to get the coordinates. It is preferable to use numbers that are easy to calculate.
The linear function is a proportional linear graph. Since the graph is always a straight line, you can draw a linear function graph by connecting the two coordinates. The following is a summary of how to draw a graph.
- Find the intercept, $(0,b)$.
- Substitute a number for $x$ and get any coordinates.
- Connect the two coordinates in a straight line
By this order, we can draw a straight line of a linear function on a graph.
-The Greater the Slope, the Steeper It Becomes
How much the $y$-coordinate increases or decreases depends greatly on the slope. If the value of slope $a$ is large, the graph will naturally become steeper. When the value of slope $a$ is small, the slope of the graph becomes gentle.
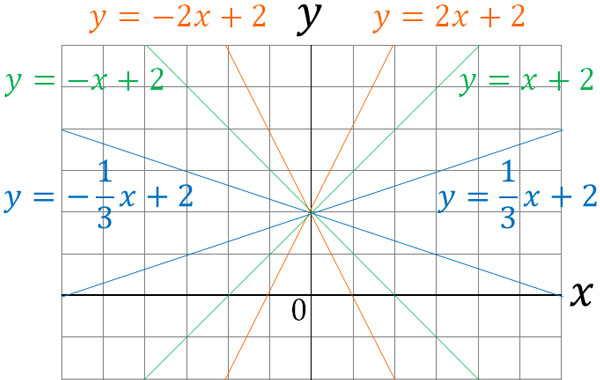
Also, if the slope is a positive number, the graph will be a straight line rising to the right. On the other hand, if the slope is a negative number, the graph will be a downward straight line to the right.
Make sure you understand this property in a linear function graph.
Rate of Change: How to Draw a Graph Including Fractions
In linear functions, you may be asked about the rate of change. What is the rate of change? Understand that the rate of change is the slope of a linear function. The rate of change and the slope are the same thing. So when you are asked about the rate of change in a linear function problem, try to answer the slope.
The rate of change is the amount of change in the value of $y$ as the number of $x$ increases. For example, for a linear function with $y=2x+3$, when $x$ increases from 0 to 2, $y$ increases from 3 to 7. When $x$ increases by 2, $y$ increases by 4, so the rate of change (slope) is 2.
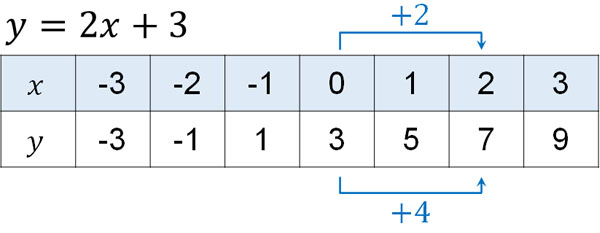
We can get the slope from the amount of change in the number of $x$ and $y$. So even if we don’t know the slope of a linear function, we can calculate the slope (rate of change) from a table or graph.
The rate of change can be calculated by the following formula.

Looking at the formula alone, it seems difficult. Also, you may think that you have to remember this formula. However, the rate of change in a linear function has the same meaning as the slope. You don’t need to remember the formula because you can just get the slope.
For example, what would be the formula for the following graph?
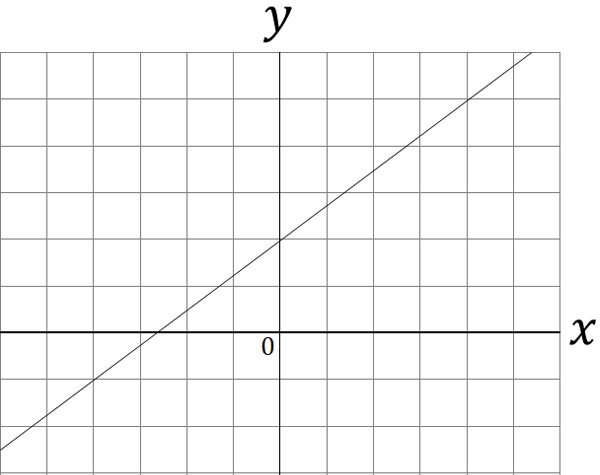
Many people have trouble drawing linear functions with fractions and finding the equation. However, even if the slope of the linear function is a fraction, we can still solve the problem if we understand the rate of change.
If we focus on the $y$-axis, we can find the intercept. So, in the graph above, $b=2$. Next, let’s calculate the rate of change in order to get the slope.
If we check the coordinates of the graph, we can find specific numbers at the following coordinates.
- $(4,5)$
- $(0,2)$
- $(-4,-1)$
If we check these coordinates, we can see that the value of $x$ is increased by 4 and the value of $y$ is increased by 3. The result is as follows.
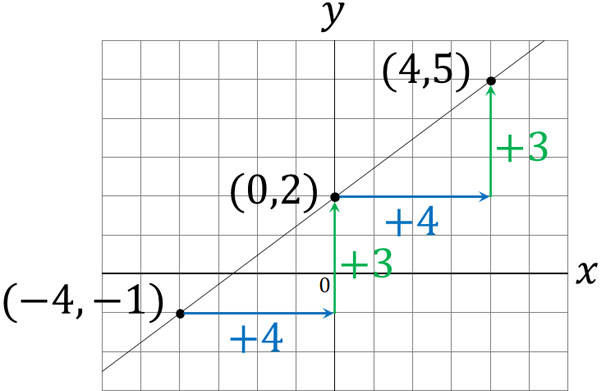
Therefore, the rate of change is $\displaystyle\frac{3}{4}$. We do not need to remember the formula to get the rate of change; we just need to get the slope to satisfy the condition of proportionality.
The formula for proportionality is $y=ax$. As the value of $x$ increases by 4, the value of $y$ increases by 3. Substituting the number into the formula, we get $4=3a$. Calculating this gives us $a=\displaystyle\frac{3}{4}$, which gives us the slope. In other words, the linear function for the graph is the following equation.
- $y=\displaystyle\frac{3}{4}x+2$
Alternatively, we can apply the coordinates to the linear function formula to get the slope. From the graph, we already know that $b=2$. Since we know the intercept, the equation in the graph is $y=ax+2$. Then substitute the coordinates $(4,5)$ or $(-4,-1)$.
For example, substituting $(-4,-1)$ would result in the following.
$-1=-4a+2$
$4a=2+1$
$4a=3$
$a=\displaystyle\frac{3}{4}$
In this way, we can get the slope from the linear function formula. You do not need to remember the formula for the rate of change. If you try hard to remember many formulas, you will forget them. So, try to remember only the most important formulas and get the answer.
-Drawing a Graph from a Linear Function Equation
We have discussed how to get an expression from a graph. On the other hand, how do we draw a graph?
The way to draw a graph from a linear function is the same. Even if the slope is a fraction, you can draw a graph using the rate of change. For example, how would you graph the following expression?
- $y=-\displaystyle\frac{2}{3}x+2$
The intercept is 2, so it passes through $(0,2)$. Also, if $x$ increases by 3, $y$ decreases by 2. In other words, if $x=3$, $y=0$. Since the straight line passes through $(3,0)$, we can draw the following graph.
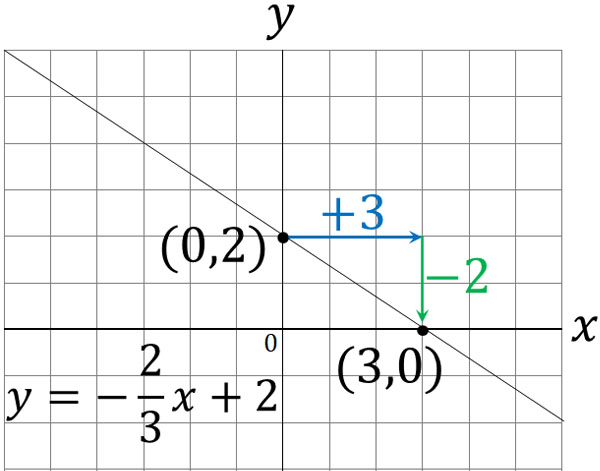
As mentioned earlier, a linear function is completed by connecting two coordinates with a straight line. Even if the slope is a fraction, the way to draw the graph is the same.
Find the Equation for a Linear Function from Intercept and Coordinates
In linear function problems, we may need to find the expression for a linear function from a graph or coordinates. How can we find the equation for a linear function? There are several ways to do this; the easiest method is to find a linear equation from the intercept and coordinates.
In some problems, the value of the intercept is already known. In that case, we can substitute the value of $b$.
Also, if we know the coordinates, we know the values of $x$ and $y$. A linear function is one in which the value of $y$ is clearly determined by substituting $x$. We can find the value of $y$ by substituting any $x$. Therefore, when you substitute the coordinates, you can get the slope.
For example, what is the expression for the linear function in the following case?
- The intercept is 1: $b=1$
- Passing through the coordinate $(2,2)$
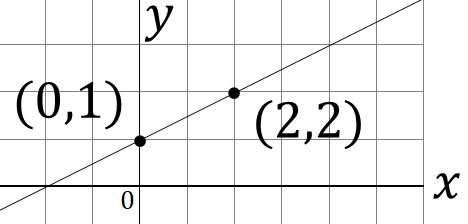
Since the intercept is 1, the equation is $y=ax+1$. And since it passes through the coordinate $(2,2)$, let’s substitute $x=2$ and $y=2$. We get the following.
$2=2a+1$
$-2a=1-2$
$-2a=-1$
$a=\displaystyle\frac{1}{2}$
The slope is $a=\displaystyle\frac{1}{2}$. Therefore, the expression of the linear equation is $y=\displaystyle\frac{1}{2}x+1$.
From the problem statement, we already know that the intercept is 1. In contrast, we don’t know the slope of the linear function. So we can substitute the coordinates and get the slope in this way.
Find the Equation for a Linear Function from a Graph
In addition, we may have to come up with an expression for a linear function from the graph. When reading a graph, check the intercept and coordinates for the graph. For example, what is the intercept and coordinates of the following graph?
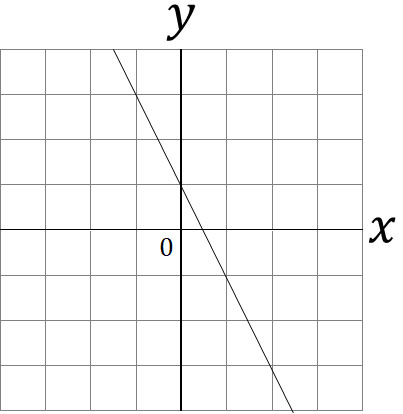
Checking the $y$-coordinate, the intercept is 1. Also, from the graph, you can substitute any coordinates. It doesn’t matter which coordinates you substitute. However, in mathematics, we need to use simple coordinates to avoid miscalculations. So, in this case, we will use the coordinate $(1,-1)$.
From the graph, the intercept is 1, so the expression of the linear function is $y=ax+1$. Also, this linear function passes through the coordinate $(1,-1)$. So let’s substitute $x=1$ and $y=-1$. The calculation is as follows.
$-1=a+1$
$-a=1+1$
$-a=2$
$a=-2$
The slope is -2, so we get the equation $y=-2x+1$. Even if we need to find the intercept and coordinates from the graph, the way to get the linear function equation is the same.
Note that it is also possible to calculate $a$ from the rate of change when reading the graph. In the previous graph, as shown below, for every one increase in the value of $x$, the value of $y$ is increased by -2. Therefore, we can see that the rate of change is -2.
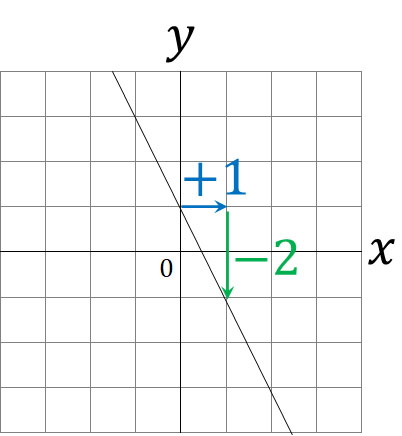
The rate of change is the same as the slope. From the intercept and the slope, we can see that the equation is $y=-2x+1$.
Calculating a Linear Function Equation Using a System of Equations
On the other hand, there are cases where we are not presented with a graph, and we do not know the intercept. All we know are the two coordinates. For example, we only know the following two coordinates
- $(-6,-7)$
- $(3,-1)$
How can we come up with an expression for a linear function? In this case, we can use systems of linear equations (or simultaneous equations) to come up with a linear function equation. Even if there are two unknown numbers, we can find the number by making two equations, which is a system of equations.
If we substitute $(-6,-7)$ and $(3,-1)$ into $y=ax+b$, we get the following.
$\begin{eqnarray} \left\{\begin{array}{l}-7=-6a+b\\-1=3a+b\end{array}\right.\end{eqnarray}$
Let’s solve this using simultaneous equations. The result is as follows.
$\begin{array}{r}-7=-6a+b\\\underline{-)\phantom{0}-1=3a+b}\\-6=-9a\\a=\displaystyle\frac{2}{3}\end{array}$
The systems of linear equations give us $a=\displaystyle\frac{2}{3}$. And by solving the simultaneous equations by substituting $a=\displaystyle\frac{2}{3}$, we can calculate $b=-3$.
For example, substituting $(3,-1)$ results in the following.
$-1=3×\displaystyle\frac{2}{3}+b$
$-1=2+b$
$b=-3$
Therefore, $y=\displaystyle\frac{2}{3}x-3$. Even if the graph is not presented, if we know the two coordinates, we can still come up with a linear function by using a system of linear equations.
How to Find Intersection Coordinates Using Linear Functions
The intersection is one of the advanced problems in linear functions; we are often asked to find the intersection point of two linear functions. How do you find the intersection point?
For example, try to find the intersection point P of the following two expressions.
- $y=-2x-2$
- $y=x+2$
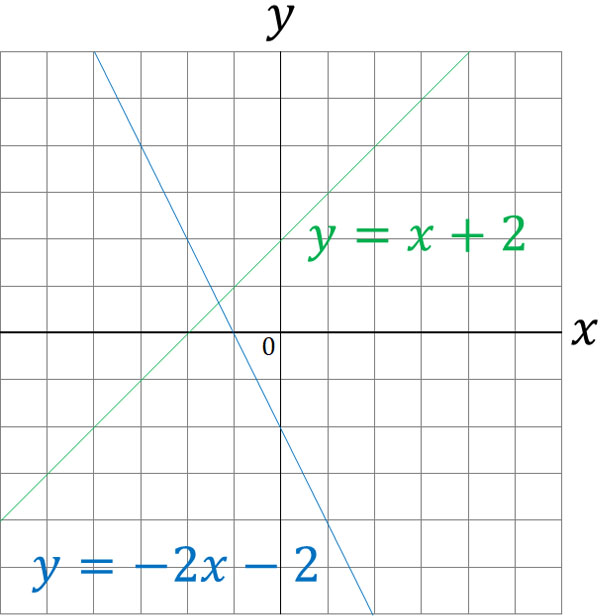
A simultaneous equation gives a value that satisfies the two equations. Let’s solve the following system of equations using $y=-2x-2$ and $y=x+2$. Then we can find the intersection point.
$\begin{eqnarray} \left\{\begin{array}{l}y=-2x-2\\y=x+2\end{array}\right.\end{eqnarray}$
Why can we find an intersection using a system of linear equations? Using simultaneous equations means the same thing as finding the values of $x$ and $y$ that satisfy $y=-2x-2$ and $y=x+2$. Calculating $x$ and $y$ that satisfy the two equations is the same as finding the intersection point.
As mentioned above, even if we have two unknown numbers, we can still come up with a number using simultaneous equations. When we solve the simultaneous equations, we get the following.
$\begin{array}{r}y=-2x-2\\\underline{-)\phantom{0}\phantom{0}y=x+2}\\0=-3x-4\\3x=-4\\x=-\displaystyle\frac{4}{3}\end{array}$
Then, substitute $x=-\displaystyle\frac{4}{3}$. For example, if we substitute $y=x+2$, we get the following.
$y=-\displaystyle\frac{4}{3}+2$
$y=-\displaystyle\frac{4}{3}+\displaystyle\frac{6}{3}$
$y=\displaystyle\frac{2}{3}$
Thus we know that the coordinate of the point P is $\left(-\displaystyle\frac{4}{3},\displaystyle\frac{2}{3}\right)$.
Exercises: Linear Function Graphs and Word Problems
Q1: Solve the following problems.
- Find the equation for the linear function of (1)
- Find the equation for the linear function of (2)
- Find the intersection of (1) and (2)
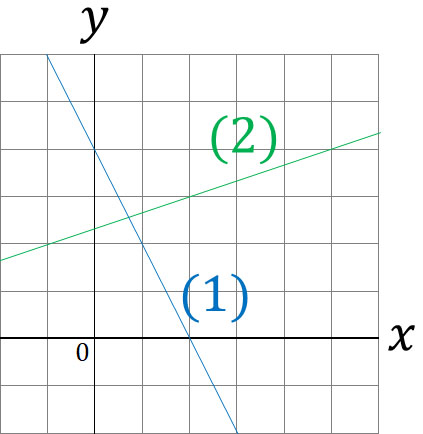
A1: Answers.
(a)
We need to find a linear equation from the graph. So, let’s focus on the intercept. In equation (1), the intercept is 4. Therefore, $b=4$.
Also, (1) passes through the coordinate $(1,2)$. Therefore, let’s substitute $y=ax+4$. We get the following.
$2=a+4$
$a=-2$
We found that the slope is -2. Therefore, equation (1) is $y=-2x+4$.
(b)
Looking at the graph, we cannot find the intercept of (2). So, let’s calculate equation (2) from two coordinates. Choose any of the (2) coordinates. For example, (2) passes through the following coordinates.
- $(2,3)$
- $(5,4)$
Next, let’s calculate the slope and intercept using a system of equations. Substituting into the formula $y=ax+b$, we get the following.
$\begin{eqnarray} \left\{\begin{array}{l}3=2a+b\\4=5a+b\end{array}\right.\end{eqnarray}$
Solving the simultaneous equations, we get the following.
$\begin{array}{r}3=2a+b\\\underline{-)\phantom{0}4=5a+b}\\-1=–3a\\a=\displaystyle\frac{1}{3}\end{array}$
Substituting $a=\displaystyle\frac{1}{3}$ into $3=2a+b$ gives the following.
$3=2×\displaystyle\frac{1}{3}+b$
$\displaystyle\frac{9}{3}=\displaystyle\frac{2}{3}+b$
$b=\displaystyle\frac{7}{3}$
Therefore, the equation in (2) is $y=\displaystyle\frac{1}{3}x+\displaystyle\frac{7}{3}$.
(c)
To get the intersection of the two equations, solve the simultaneous equations. Now that we have the linear functions (1) and (2), we can use these two equations to create the following system of equations.
$\begin{eqnarray} \left\{\begin{array}{l}y=-2x+4\\y=\displaystyle\frac{1}{3}x+\displaystyle\frac{7}{3}\end{array}\right.\end{eqnarray}$
Using the substitution method, we get the following.
$-2x+4=\displaystyle\frac{1}{3}x+\displaystyle\frac{7}{3}$
$(-2x+4)\textcolor{red}{×3}=\left(\displaystyle\frac{1}{3}x+\displaystyle\frac{7}{3}\right)\textcolor{red}{×3}$
$-6x+12=x+7$
$-6x-x=7-12$
$-7x=-5$
$x=\displaystyle\frac{5}{7}$
Then substitute $x=\displaystyle\frac{5}{7}$ for $y=-2x+4$. The result is as follows.
$y=-2×\displaystyle\frac{5}{7}+4$
$y=-\displaystyle\frac{10}{7}+\displaystyle\frac{28}{7}$
$y=\displaystyle\frac{18}{7}$
Thus the intersection point of (1) and (2) can be calculated as $\left(\displaystyle\frac{5}{7},\displaystyle\frac{18}{7}\right)$.
Q2: Solve the following problems.
There is a triangle AB=10 cm, BC=6 cm, and ∠ABC=90°. Point P starts from A, passes through B at a speed of 1 cm/sec, and goes to C. The area of △APC at $x$ seconds after point P leaves A is $y$ cm2.
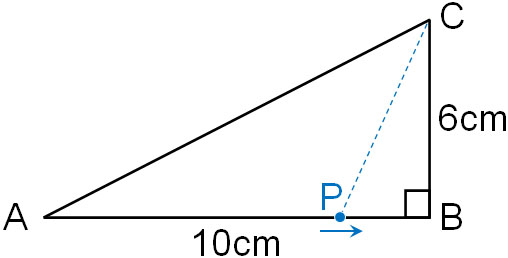
- Calculate the area of △APC after 8 seconds.
- Use the inequality sign to express the domain of $x$ and the domain of $y$.
- When point P is on BC, express the relationship between $x$ and $y$.
A2: Answers.
(a)
After 8 seconds, the length of the AP is 8 cm. This means that the horizontal length of the triangle is 8 cm. On the other hand, the vertical length is 6 cm. The formula for the area of the triangle is as follows.
- The area of a triangle = Width × Height × $\displaystyle\frac{1}{2}$
Therefore, the area of the triangle is as follows.
- $8×6×\displaystyle\frac{1}{2}=24$
The answer is 24 cm2.
(b)
The total length of AB and BC is 16 cm. Since point P travels 1 cm per second, it arrives at C after 16 seconds. Therefore, the domain of $x$ is as follows.
- $0≤x≤16$
On the other hand, as for the area of △APC, the area of △APC becomes the largest when point P arrives at B. This is because as point P moves on BC, the area of △APC becomes smaller. Also, the area of △ABC is as follows.
- $10×6×\displaystyle\frac{1}{2}=30$
Therefore, the domain of $y$ is as follows.
- $0≤y≤30$
(c)
When the point P is on BC, the horizontal length is fixed at 10 cm. On the other hand, the vertical length varies. If we can find the vertical length (length of CP), we can create an equation that expresses the area of △APC.
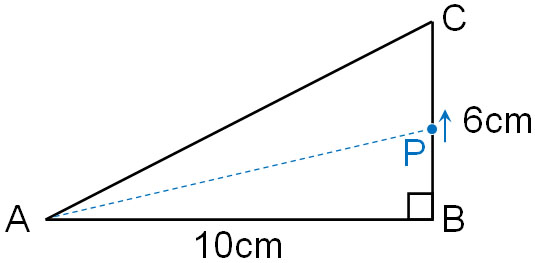
How do we figure out the length of the CP? It is difficult to think in terms of a triangle. So, let’s consider the length of the CP in the following straight line.

The length of the AC is 16 cm. And since it moves at 1 cm per second, the length of the AP after $x$ seconds is $x$ cm. So, the length of the CP is $(16-x)$.
The horizontal length is 10 cm and the vertical length is $(16-x)$ cm. Therefore, the area of △APC is as follows.
$y=10×(16-x)×\displaystyle\frac{1}{2}$
$y=5×(16-x)$
$y=-5x+80$
Create and Solve Equations for Linear Functions
A field that is similar to direct proportion is linear functions. Think of linear functions in mathematics as a special case of proportions.
There are so many situations where we have to use linear functions to make calculations. For example, when you calculate your future savings, you use linear functions. When calculating, we need to find the slope and intercept to create an equation.
Also, in linear functions, there are many problems that use graphs. So you need to be able to calculate the slope and intercept from the graph. By using coordinates, we can get an expression for a linear function. Also, by using simultaneous equations, we can find the intersection of two lines.
Once you understand the properties of these linear functions, you will be able to use mathematics in all aspects of your daily life.


