An important concept in mathematics is direct proportion and inverse proportion. We frequently use the words direct proportion and inverse proportion in our daily lives. Direct proportion and inverse proportion are familiar to us and are concepts that everyone uses. The concept of direct proportion and inverse proportion is used in many situations.
When studying direct proportion and inverse proportion, we can’t understand it by looking at numbers. In mathematics, it is common to use graphs to learn about direct proportion and inverse proportion. Therefore, when learning direct proportion and inverse proportion, you must also understand coordinates.
In addition, in direct proportion and inverse proportion, there are positive and negative values. Depending on whether it is positive or negative, the shape of the graph will change.
Direct proportion and inverse proportion are also common knowledge. So learn the graph coordinates and understand the concept of direct proportion and inverse proportion.
Table of Contents
- 1 The Definition of the Function Is Whether the Numbers Are Determined
- 2 The Concept of Proportion and Constant of Proportionality
- 3 Inverse Proportion: Formula, Tables, and Graphs Shape
- 4 Exercises: Word Problems and Graphs of Direct Proportion and Inverse Proportion
- 5 Learning Direct Proportion and Inverse Proportion Equations and Graphs
The Definition of the Function Is Whether the Numbers Are Determined
Most mathematics is expressed in algebraic expressions. In other words, we use expressions that use the alphabet. In expressions that use letters, the word “function” is frequently used. When we learn about graphs in mathematics, we use the words linear and quadratic functions.
So what is a function? The definition of a function is as follows.
- By determining the value of $x$, the value of $y$ is determined.
When this condition is met, it is a function. For example, are the following two examples functions?
- A person with height $x$ cm is $y$ kg in weight.
- Walking for 3 hours at $x$ km per hour, the distance walked is $y$ km.
Height and weight vary from person to person. A person may be 170 cm tall and weigh 50 kg, while another person may weigh 70 kg. Even if we determine the value of $x$, we cannot determine the value of $y$. Therefore, it is not a function.
On the other hand, if the distance is $y$ km, then if you walk for 3 hours at $x$ km/h, you can make the following equation.
- $y=3x$
By determining the value of $x$, the value of $y$ is clearly determined. This is a function. Whether or not it is a function depends on whether or not you can determine a specific number.
The Concept of Coordinates: $x$ Axis, $y$ Axis, and Origin
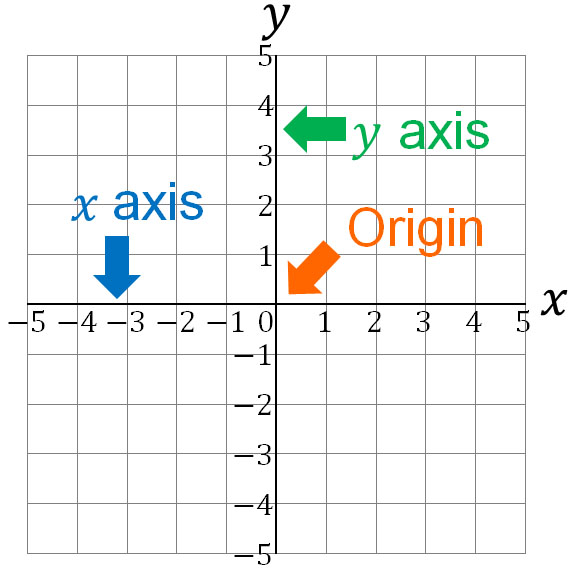
After learning the definition of functions, to understand direct proportion and inverse proportion, we must understand the concept of coordinates. A graph represents the position of a point and the shape of a line.
In a graph, the horizontal axis is called the $x$ axis. On the other hand, the vertical axis is called the $y$ axis. The intersection point of the $x$ and $y$ axes is called the origin.
When we use graphs in mathematics, we write points. It is the coordinates that indicate where the point is located in the graph. For example, in the following graph, the coordinate of the point P is $(3,-2)$.
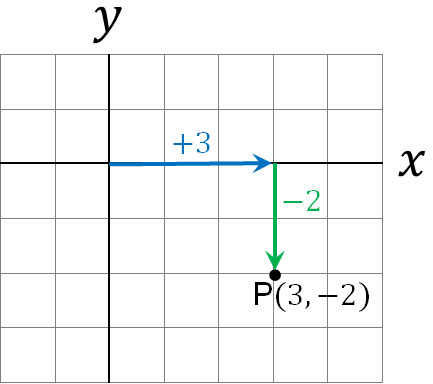
In the coordinates of $P(3,-2)$, 3 is called the $x$ coordinate, and -2 is called the $y$ coordinate. In any case, the points that exist in the graph are called coordinates.
The Concept of Proportion and Constant of Proportionality
After you understand the definitions and concepts about functions and coordinates, you can learn about proportionality. Proportionality refers to a function that as the value of $x$ increases, the number of $y$ increases at the same rate.
Let’s consider the following example, which is the same as the previous one.
- Walking for 3 hours at $x$ km per hour, the distance walked is $y$ km.
This function is $y = 3x$. Therefore, as the value of $x$ increases by 1, $y$ is increased by 3. Also, if the value of $x$ decreases, the value of $y$ decreases by the same ratio. The table looks like the following.
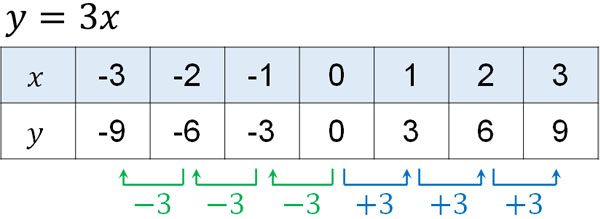
A change in the value of $x$ causes $y$ to increase (or decrease) by 3. This is direct proportionality. In this equation, $y=3x$, so the value of $y$ changes by 3. On the other hand, for example, if $y=5x$, the value of $y$ will change by 5 as the value of $x$ changes.
Therefore, in direct proportional coordinates, we use the following formula.
- $y=ax$
$a$ is called a constant of proportionality. The value of $a$ is different for each. In the previous equation, walking at $x$ km/h for 3 hours, resulting in $y=3x$. On the other hand, if you walk at $x$ km/h for 4 hours, $y=4x$. The constant of proportionality, $a$, changes depending on the problem.
How to Draw Direct Proportions in a Graph: the Coordinates of $y=ax$
So what is the relationship between a function and a graph of direct proportion? We have just described the table of $y=3x$ as an example.
As the value of $x$ changes, the value of $y$ also changes. Note that the values of $x$ and $y$ are coordinates. In short, we have the following.
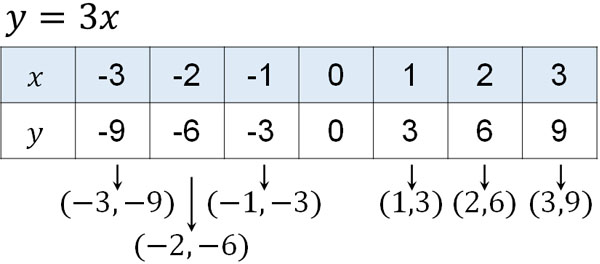
So, let’s write these coordinates on the graph. And if we connect each coordinate, we get the following.
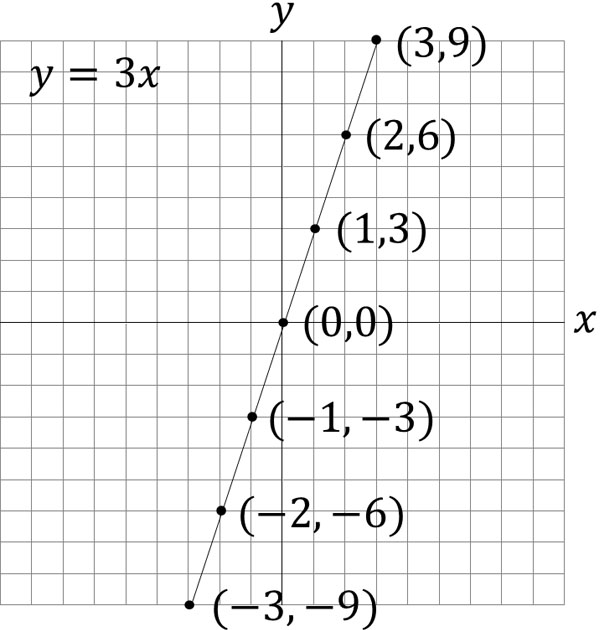
In a direct proportional graph, the line is always a straight line. Also, a line always passes through the origin. We can create a graph from the formula $y=ax$.
Also, you can get the formula $y=ax$ from the graph. For example, if $y$ increases by 2 for each increment of $x$, we get the equation $y=2x$.
The Shape of the Graph Differs Whether the Constant of Proportionality Is Positive or Negative
There’s something else that’s important when considering proportional expressions. That is, whether the constant of proportionality $a$ is a positive number or a negative number.
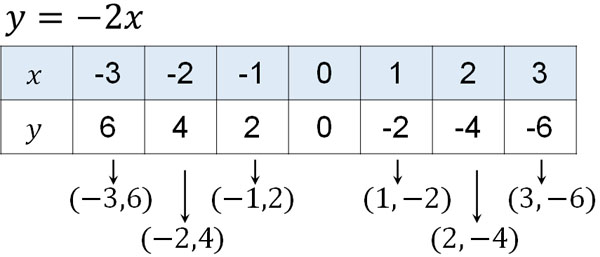
So far, we have considered the graph of proportionality by assuming that $a$ is a positive number. On the other hand, if $a$ is a negative number, what does a linear graph of proportionality look like? The idea is the same as before, and let’s consider the graph when $a$ is negative. For example, suppose we have the following equation.
- $y=-2x$
In this case, when $x$ increases by one, $y$ increases by -2. The table looks like the following.
A graph of this table would look like the following.
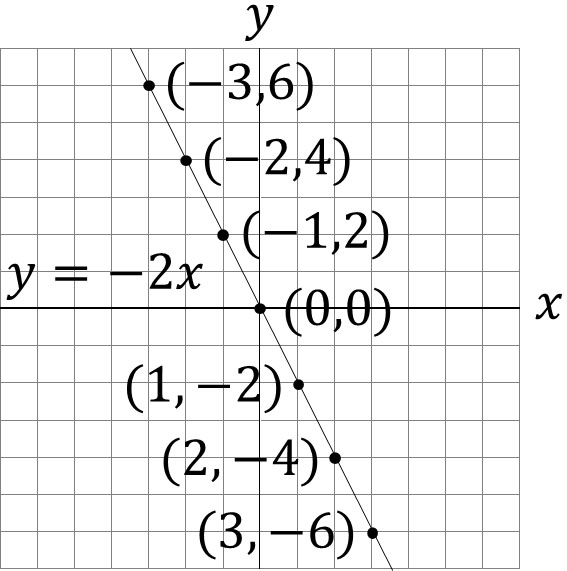
If $a$ is a positive number, the graph of the line will go up to the right. On the other hand, if $a$ is a negative number, the graph of the line will be downward to the right. Depending on whether the value of $a$ is positive or negative, the shape of the graph will change.
Inverse Proportion: Formula, Tables, and Graphs Shape
After learning the functions of direct proportion, one thing you must study is inverse proportion. Compared to direct proportion, an inverse proportion is a little more difficult to understand.
When $a$ is a positive number, in direct proportion, as the value of $x$ increases, the value of $y$ also increases at the same rate. In contrast, in inverse proportion, when $a$ is a positive number, the value of $y$ decreases as the value of $x$ increases. In contrast to direct proportion, the opposite is true in inverse proportion.
While $y=ax$ is the formula for direct proportion, the formula for inverse proportion is as follows.
- $y=\displaystyle\frac{a}{x}$
In what situations does it become an inverse proportional function? For example, if you multiply the speed by time, you get the distance. If you walk 6 km at $x$ km/h and $y$ hours, you have the following equation.
- $x×y=6$
- $y=\displaystyle\frac{6}{x}$
There is a fixed distance of 6 km to walk. Therefore, if you increase $x$ km/h (walking speed), the value of time to arrive ($y$) will be smaller. On the other hand, if you decrease the speed of $x$ km/h, the value of time to arrive ($y$) will increase. If one value is larger and the other value is smaller, there is an inverse proportional relationship.
The equation for inverse proportionality described earlier is shown in the table below.
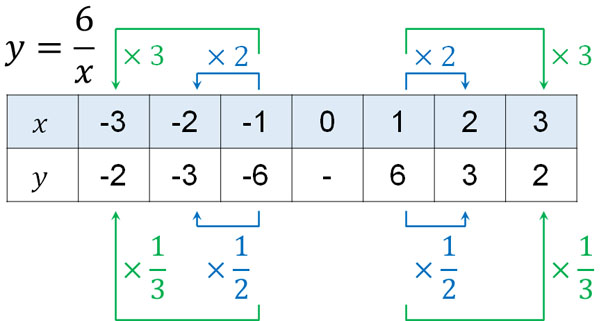
If the value of $x$ is doubled, the value of $y$ will be $\displaystyle\frac{1}{2}$. And if the value of $x$ is tripled, the value of $y$ is $\displaystyle\frac{1}{3}$. In the case of inversely proportional, it is the opposite of direct proportional.
For this table, the graph looks like this.
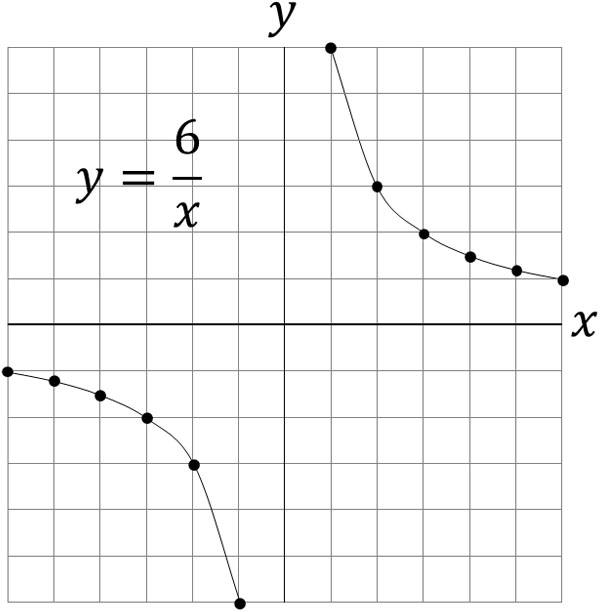
A graph of direct proportion is always a straight line. On the other hand, a graph of inverse proportion is always a curve. The curve of inverse proportion is called a hyperbola. The shapes of the graphs of direct proportion and inverse proportion are quite different.
Curve Graphs Differ in Positive and Negative
In direct proportion, we explained that the shape of the graph depends on whether the constant of proportionality, $a$, is positive or negative. The same is true for the graph of inverse proportion.
Earlier, we explained what the graph of inverse proportion looks like in the case of $a>0$. On the other hand, for $a<0$, the graph of inverse proportion looks like this.
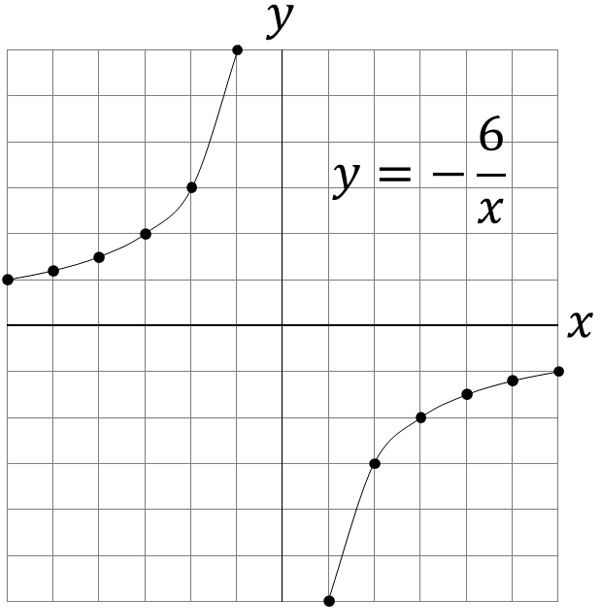
As $x$ doubles, triples or quadruples in number, the value of $y$ becomes similarly $\displaystyle\frac{1}{2}$, $\displaystyle\frac{1}{3}$, and $\displaystyle\frac{1}{4}$. However, it is important to understand that the graph shape is different depending on whether the constant of proportionality is a positive or negative number.
Exercises: Word Problems and Graphs of Direct Proportion and Inverse Proportion
Q1: Do the following calculations.
You buy a metal with a price of \$100 for 40 grams.
- How much is the price for 1 gram of metal?
- If the amount to be paid is $y$ dollars and the weight of the metal is $x$ g, create an equation that expresses $y$ with $x$.
- How much does 26g of metal cost?
A1: Answers.
Direct proportion is frequently used in everyday life. When shopping, we use proportionality to calculate how much to buy and how much to spend. If you can’t do this calculation, you will have trouble in shopping.
(a)
Since we don’t know the price of one gram of metal, let’s assume this number is $a$. The price of 1 g of metal is $a$, and the price of 40 g of metal is $100. Therefore, the equation is as follows.
$40×a=100$
$40×a\textcolor{red}{×\displaystyle\frac{1}{40}}=100\textcolor{red}{×\displaystyle\frac{1}{40}}$
$a=2.5$
(b)
The price of 1 gram of metal is 2.5 dollars. If the amount to be paid is $y$ dollars and the weight of the metal is $x$ g, we can make the following proportional equation.
- $y=2.5x$
(c)
Once we make a proportional equation, we can also get the value of $y$ by substituting the value of $x$. If we buy 26 grams of metal, we get the following amounts.
$y=2.5×26$
$y=65$
Q2: Do the following calculations.
The distance from your house to the library is 3000 m. Walk at a speed of $x$ m/min and it will take you $y$ minutes to arrive.
- Create an equation that expresses $y$ with $x$.
- If you walk at a speed of 50 m/min, how many minutes will you spend to arrive?
- If you want to arrive in 30 minutes, how many meters per minute do you have to run?
A2: Answers.
(a)
Multiplying the speed by the time gives the distance. Therefore, we have the following inversely proportional equation.
$x×y=3000$
$y=\displaystyle\frac{3000}{x}$
(b)
Substituting a number into the inverse proportion equation will give you the answer.
$y=\displaystyle\frac{3000}{50}$
$y=60$
(c)
In calculating a function, we don’t necessarily substitute $x$. Sometimes we substitute $y$ to get the answer. Since $y=30$, we have the following.
$30=\displaystyle\frac{3000}{x}$
$30\textcolor{red}{×\displaystyle\frac{x}{30}}=\displaystyle\frac{3000}{x}\textcolor{red}{×\displaystyle\frac{x}{30}}$
$x=100$
Q3: Answer the following questions.
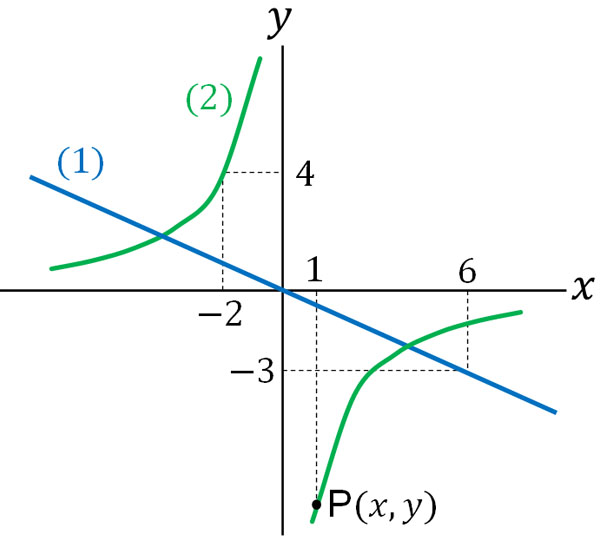
- For the line in (1), find the constant of proportionality for $y=ax$.
- For the hyperbola of (2), find the constant of proportionality for $y=\displaystyle\frac{a}{x}$.
- Find the coordinates of P.
A3: Answers.
In problems of direct proportion and inverse proportion, it is important to be able to solve not only word problems but also graph problems.
(a)
In the direct proportion graph, we can substitute the coordinates into $y=ax$ to get the constant of proportionality. Since the straight line has the coordinate $(6,-3)$, let’s substitute this into the formula.
$-3=6a$
$6a\textcolor{red}{×\displaystyle\frac{1}{6}}=-3\textcolor{red}{×\displaystyle\frac{1}{6}}$
$a=-\displaystyle\frac{1}{2}$
(b)
Likewise, we can substitute the coordinates to get the constant of proportionality. The hyperbola graph has the coordinate $(-2,4)$, so let’s substitute it.
$4=\displaystyle\frac{a}{-2}$
$\displaystyle\frac{a}{-2}\textcolor{red}{×(-2)}=4\textcolor{red}{×(-2)}$
$a=-8$
(c)
The $x$-coordinate of the point P is 1. We can also calculate the $y$-coordinate of the point P by using the answer to (b). The result is as follows.
- $y=-\displaystyle\frac{8}{x}$ (substitute $x=1$)
- $y=-\displaystyle\frac{8}{1}$
- $y=-8$
The coordinate of the point P is $(1,-8)$.
Learning Direct Proportion and Inverse Proportion Equations and Graphs
In math functions, we learn about direct proportion and inverse proportion. Direct proportion and inverse proportion are familiar, and many people use them in their daily lives, such as when shopping. If you can’t calculate direct proportion and inverse proportion, you will be in trouble in everyday life. So, let’s understand the concept of direct proportion and inverse proportion.
Direct proportion is that when the value doubles, the number you want to find also doubles. On the other hand, inverse proportion means that when the value is doubled, the number you want to find is halved.
We also learn about graphs in direct proportion and inverse proportion at the same time. So, let’s understand the concept of coordinates so that we can create direct proportional and inverse proportional equations from graphs.
Distinguish whether it is direct or inverse proportion. After that, you will be able to find and calculate the constant of proportionality to get the answer.